
‘Market Share’ is one of the key performance indicators for brands as it helps them understand where they rank vis-a-vis competitors and what they can learn from competitors. In addition, market share data allows brands to decide how they want to position themselves and develop their business plan. Market share is such an important metric that it is specified explicitly in their annual reports, exchange filings, and investor presentations for listed companies. Now that we have established the importance of market share data, let us understand how brands acquire this data.
The traditional approach of accessing market share data involves getting data from market research companies like Neilson and IRI. However, the information is restricted to offline sales of brands and their competitors. The last decade has seen the advent of many digital-only brands, and the covid-19 pandemic has led to accelerated online adoption as an important sales channel. Like Neilson and IRI, no equivalent data sources are available that provide market share data for brands sold online. Therefore, brands need to combine offline and online market share data to have a holistic market share picture while planning future strategies.
Challenges in computing online market share data
Almost all brands have their products listed on major e-commerce marketplaces and aggregators. Besides being listed on such marketplaces, brands are setting up their websites to establish direct relationships with consumers and to garner higher profit margins. While the presence of multiple sales avenues aides in brand visibility and increased sales, they inherently complicate the process of market share computation as,
- Most e-commerce marketplaces and data aggregators do not disclose online e-commerce sales for all brands in a category.
- Most countries have multiple e-commerce platforms, making estimation of units sold across all the platforms difficult.
Some e-commerce platforms like Shopee, which has operations in Southeast Asia, and HKTV Mall in Hong Kong provide data about ‘units sold’ at the SKU level. However, these platforms makeup only a fraction of the entire market, thus not fulfilling market share data computation.
A data-driven approach for getting online market share data
While most e-commerce platforms do not explicitly share the units sold for each SKU, they provide ratings and reviews for each SKU as they add credibility to the platform apart from influencing purchase decisions.
With the hypothesis that customer ratings and reviews can be used as a proxy to units sold, we started analyzing data in the geography of Indonesia. The logic behind the usage of customer reviews was that more sales trigger more reviews and more reviews convince more users to buy products.
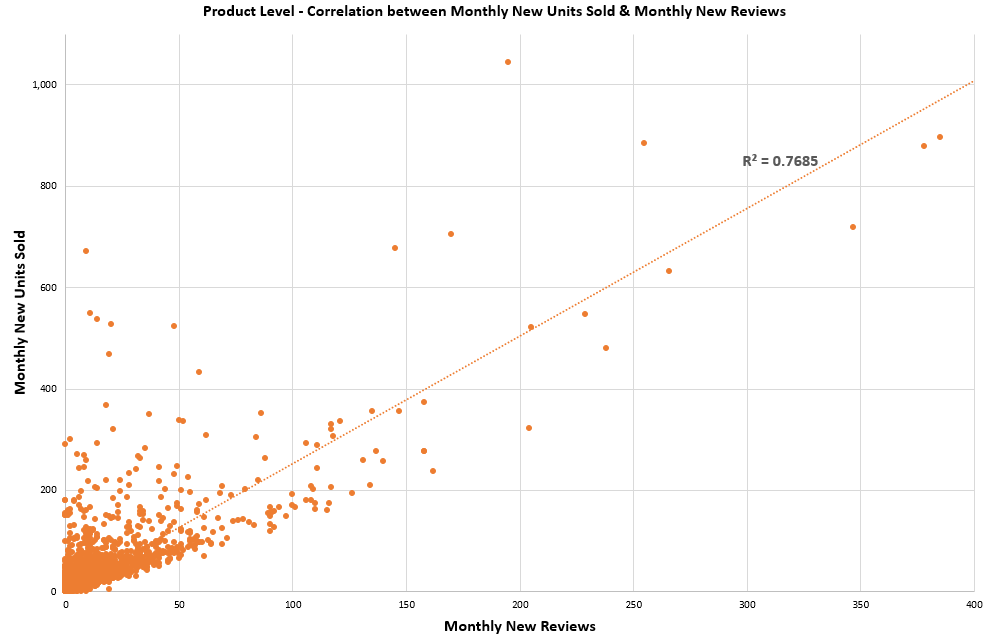
During our analysis of e-commerce products in Indonesia, we saw a strong correlation between monthly new units and monthly new reviews. As illustrated in the following graph, the correlation between new units sold and new reviews is very strong (as indicated by an R-square of 75%).
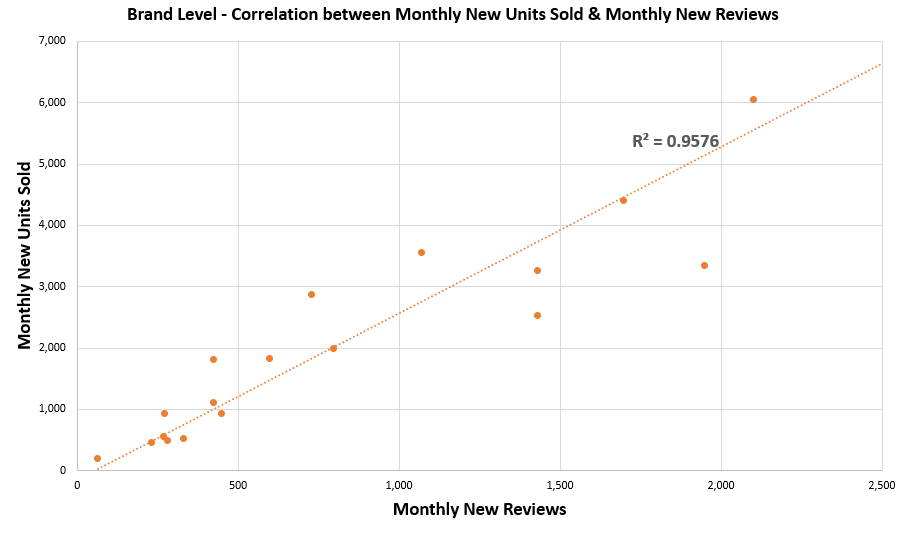
As we roll up to brand level, correlation strengthens further, as indicated by a higher R-square of 95%, due to reduced fluctuations in new units sold and new reviews.
Conclusions
Such strong correlations between reviews and units sold to justify the hypothesis that ratings and reviews help quantify market share in a given category. Additionally, reviews explain why a brand is leading or trailing competitors. Finding such root causes helps brands decide the actions they need to take to improve their market share.
At SetuServ we use our proprietary machine-learning algorithm to find such root causes from large amounts of e-commerce data across multiple geographies.