Use Of Consumer Language for Efficient Ad Copies, Descriptions, and Titles of your Product Listing

Do you want to ensure your promotions resonate with your customers in your ad copies, titles, descriptions, and bullet points? It cannot be easy to know what will draw customers in. That’s why understanding “drivers and drainers” is key. Drivers are the factors that draw customers in. When you understand those key drivers, you can use them to your advantage in your promotional efforts. For example, if your product appeals to eco-conscious customers, emphasizing how it’s made with sustainable materials or great for the environment can be a great driver. On the other hand, drainers are the factors that can turn customers away. These are the elements you want to avoid in your marketing. If you’re trying to reach an eco-conscious audience, for example, promoting the product’s low price point might turn them off. By understanding the drivers and drainers in your target audience, you can create promotional materials that speak to them. This can be the difference between a successful campaign and one that falls flat. So take the time to research your customers and identify their drivers. Then, you’ll be well on crafting the perfect ad copy, titles, descriptions, bullets, consumer language, and ingredients.

Let’s assume you are selling a smartphone on amazon and would like to emphasize your smartphone’s performance. Let’s see how this can be done. First, we collected reviews from amazon.in for smartphones in the price range above Rs.1,00,000. Then, we ran these reviews through our state-of-the-art machine learning models to extract topics and run sentiment analysis. We got all the reviews containing mentions of the topics related to “performance” – “performance”, “product performance”, etc. Then we ran these models through our topic extraction framework again to learn what customers are talking about when they are talking about performance. The following stacked bar chart shows the most frequently spoken topics with performance.
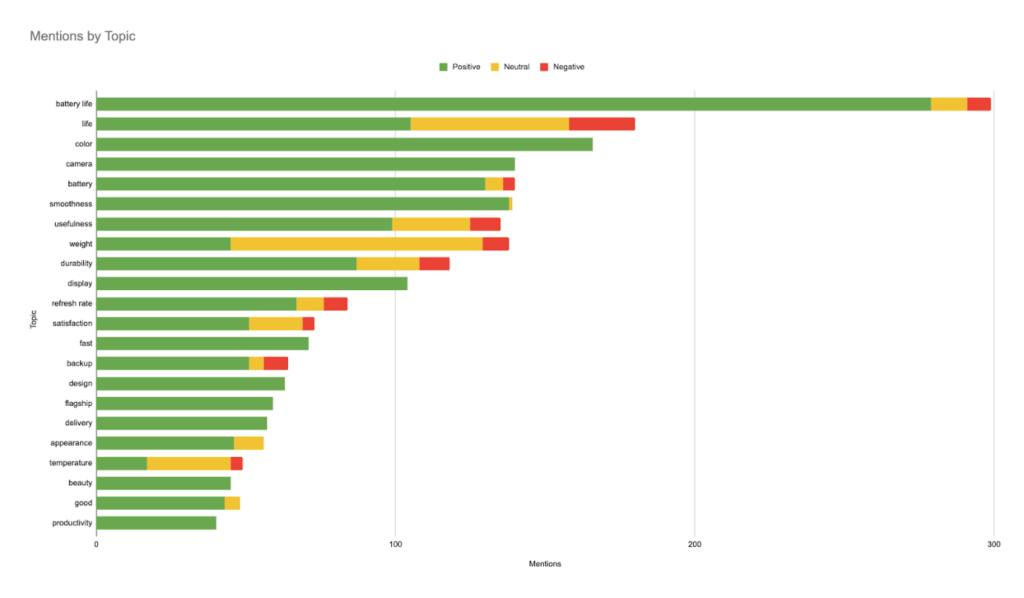
These topics can be used in any content like ad copies and descriptions where the performance of the smartphone needs to be emphasized. As we pick these up from customers’ voices, these words are more likely to strike the right chords in the customers’ minds.

In another case, we looked at a specific smartphone listing – Apple iPhone 13 Pro Max (256GB) – Graphite. When we analyzed the reviews with our topic and sentiment lens, we found the following topic sentiment stacked bar chart
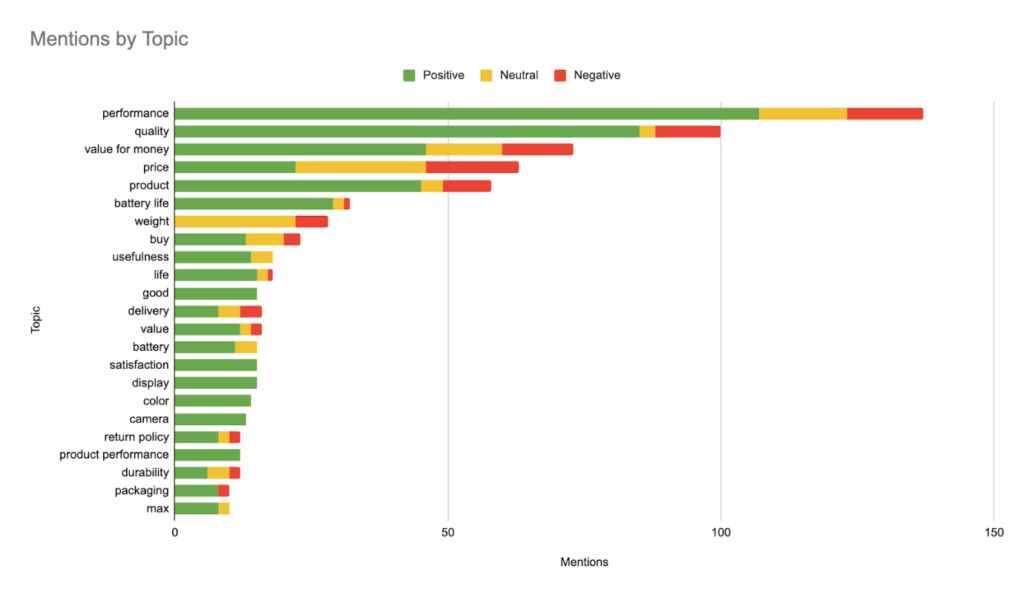
The above chart shows that the “weight” of the phone is primarily neutral and sometimes negatively perceived. There was no mention of the weight on the amazon product listing page. Looking at the reviews, it’s clear that people didn’t expect this and felt let down.

Handling the expectation of heavier weight via description or bullet points on the listing page can help avoid more such negative experiences for other customers.

These are simple examples. We can gain deeper insights by drilling into your topics and competitor topics to highlight your product’s advantages, etc. If this sounds interesting and helpful analysis for your products, please reach out to us by filling out the form below.

Fill in the details for more information

Qualitative Research for your new product launch

Running a business in the digital age means constantly innovating and creating new products. But before you launch, you need to ensure your target audience will be receptive to your product – or not.


There are tools out there that claim to be amazon product research tools – Jungle Scout, Helium10, etc. These tools are good at quantitative aspects like which products are running out of stock, the price, discount variations, etc. They lack the qualitative aspects which help you gain an edge over your competitors.


When you launch a new product, addressing customer dissatisfaction is a key factor. By understanding what customers are looking for, you can create a strategy to fill the gaps and differentiate yourselves from the competitors. One way to do this is to identify the drivers and drainers of customer satisfaction in a particular category. Drivers are features that customers look for and value when making a purchase decision. Drivers are what will make customers stay loyal to a company and buy from them again in the future. Drainers, on the other hand, are features that customers find unsatisfactory or do not find important when making a purchase decision. Drainers are more important when you need to find new opportunities. They help identify and understand the niche segment in the market that is unsatisfied with the current status quo. By understanding both drivers and drainers, you can identify the needs and wants of your customers and create a product or service that meets those needs and can capture that market share.


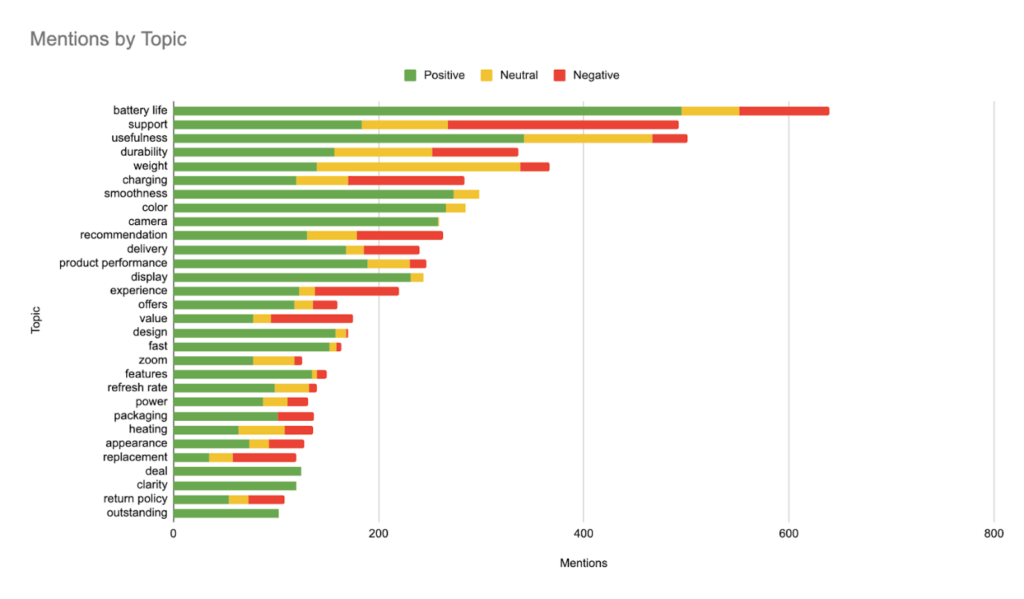
Let’s say you are looking to launch a new smartphone in a price range above Rs. 1,00,000. To determine the drivers and drainers, you must analyse some customer feedback. In this case, we are taking amazon reviews. From the reviews, you should examine the volume of mention of different topics in customer feedback and the sentiment associated with them. We extracted this data and ran it through our state-of-the-art machine learning models which extract topics and do sentiment analysis. Then we visualized this data using the stacked bar chart.

We can see that support and charging/battery are specific actionable topics that customers dislike more. Close to 50% of customers are talking negatively about these topics. Some examples:


Charging:

Support:

You can focus on providing better after-sales customer support and faster charging/ more reliable and larger battery for your new smartphone product to attract this unsatisfied customer segment. There are other non-specific topics like experience, value, etc which can be further analyzed to get more specific topics. While improving on these draining topics, your product needs to do well on smoothness, color, camera, display, design, and speed as these topics are liked in almost all products in this segment and hence they would be the minimum expectations from any new product in this segment.


This is a simple example. There is a lot more we can understand by drilling down into the topics to get subtopics and more granular insights. If this sounds interesting and helpful analysis for your products, please reach out to us by filling out the form below.

Fill in the details for more information

Digital Identities and real time insights from physicians

About half of the physicians in the top 10 therapeutic areas are active digitally. Many of these HCPs have been sharing their insightful opinions/experiences digitally on drugs, studies, and treatments during the pandemic across various therapeutic areas. In the Top 10 therapeutic areas, we identified ~70k physicians with digital identities.

They are digitally active across a variety of sources, such as

  • Publications: PubMed, Google Scholar, Semantic Scholar

  • Clinicaltrials.org

  • Social Media such as Twitter

  • Media articles

In addition, physicians’ research activities can be tracked from CMS Open Payments

Harvesting physician opinions, and mining them with AI technology can help identify key digital opinion leaders, uncover HCP perceptions and answer Key Business and Research Questions in real-time. Listed below are a few example questions.


  • Which HCPs are active on public platforms? Who are the national, regional, and local Digital Opinion Leaders (DOLs) based on signals from social media, network graphs, publications, and CMS open payments?

  • What are our target HCPs posting online?

  • What are DOL perceptions on new clinical trials, studies, drugs, etc.?

  • What is the quantitative and qualitative impact of all the events on HCP perceptions on our and competitors’ drugs?

  • What are the key messaging changes of competitor websites?

To get a proof of concept on how this solution can uncover rich, actionable insights for your drug/therapeutic area, please reach out to [email protected].