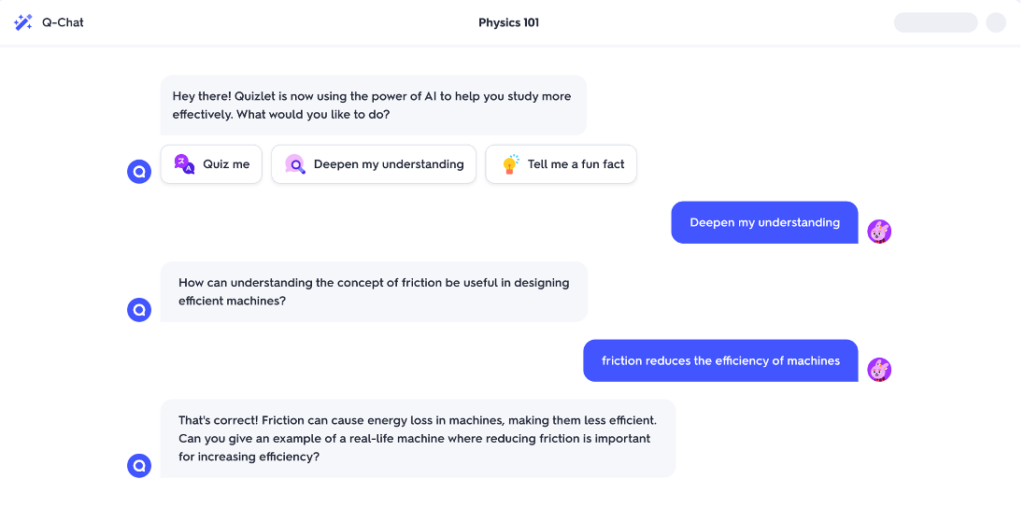
Running a business in the digital age means constantly innovating and creating new products. But before you launch, you need to ensure your target audience will be receptive to your product – or not.
There are tools out there that claim to be amazon product research tools – Jungle Scout, Helium10, etc. These tools are good at quantitative aspects like which products are running out of stock, the price, discount variations, etc. They lack the qualitative aspects which help you gain an edge over your competitors.
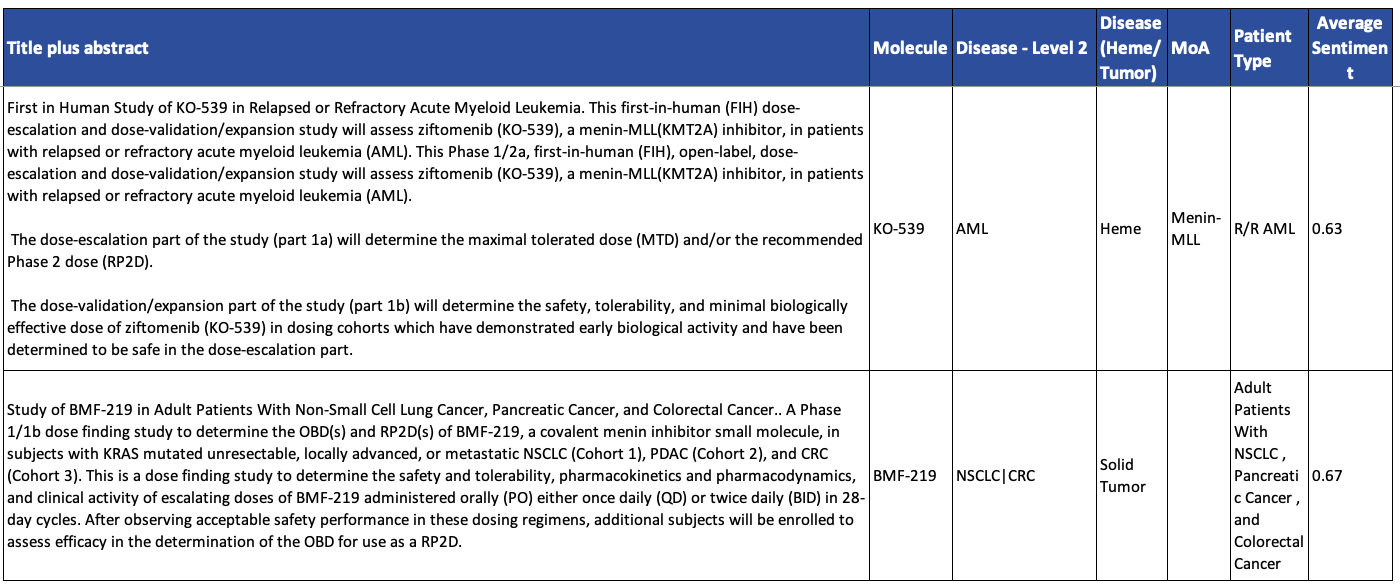
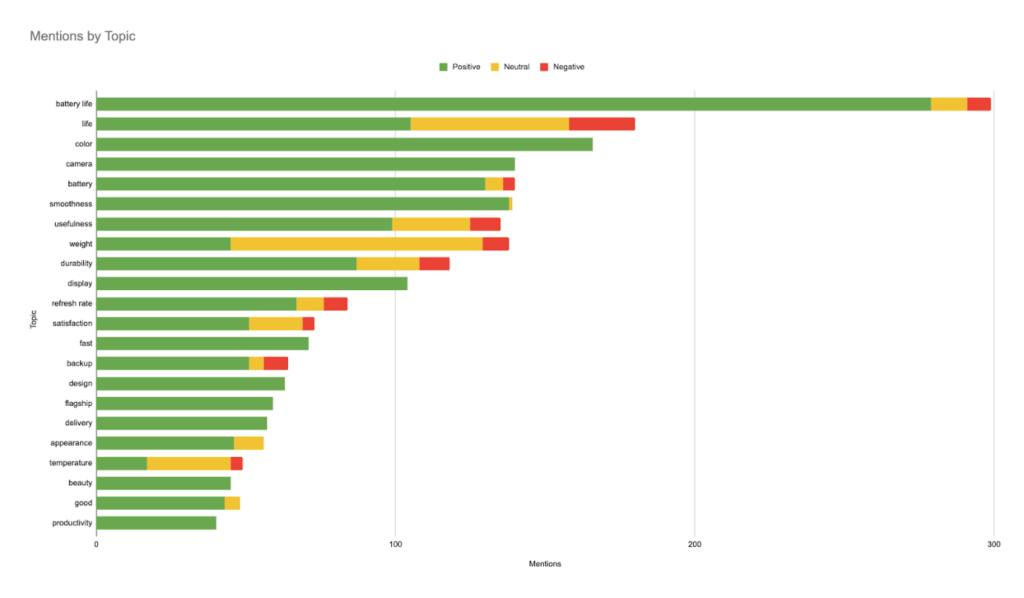
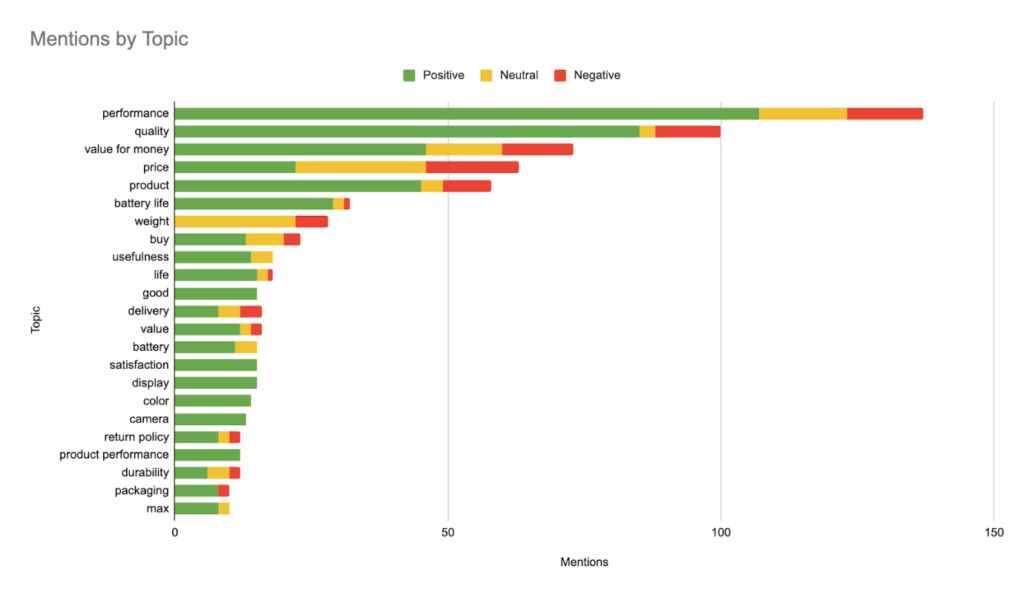
When you launch a new product, addressing customer dissatisfaction is a key factor. By understanding what customers are looking for, you can create a strategy to fill the gaps and differentiate yourselves from the competitors. One way to do this is to identify the drivers and drainers of customer satisfaction in a particular category. Drivers are features that customers look for and value when making a purchase decision. Drivers are what will make customers stay loyal to a company and buy from them again in the future. Drainers, on the other hand, are features that customers find unsatisfactory or do not find important when making a purchase decision. Drainers are more important when you need to find new opportunities. They help identify and understand the niche segment in the market that is unsatisfied with the current status quo. By understanding both drivers and drainers, you can identify the needs and wants of your customers and create a product or service that meets those needs and can capture that market share.
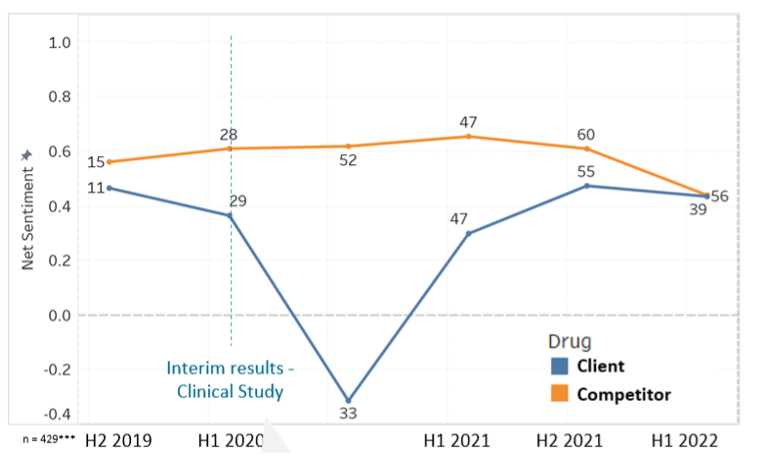
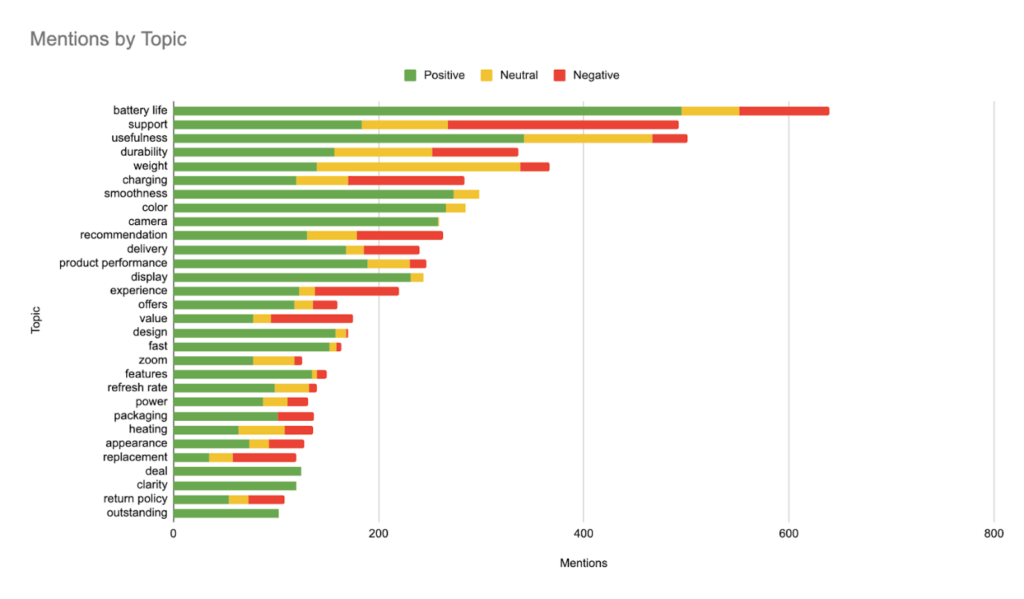
Let’s say you are looking to launch a new smartphone in a price range above Rs. 1,00,000. To determine the drivers and drainers, you must analyse some customer feedback. In this case, we are taking amazon reviews. From the reviews, you should examine the volume of mention of different topics in customer feedback and the sentiment associated with them. We extracted this data and ran it through our state-of-the-art machine learning models which extract topics and do sentiment analysis. Then we visualized this data using the stacked bar chart.